Introduction
Research into existing heat network projects and feasibility studies indicates that including wind and solar generation to provide power to the network heat pumps consistently improves project finances, both by reducing the unit price of electricity consumed by the heat pumps and generating an income through sales of excess electricity to a private off-taker and/or the grid. Sharenergy’s experience investigating a potential heat network at Bishop’s Castle indicated that wind power can work particularly well with heat generation since the periods of higher heat demand and higher winds are well correlated throughout a year.
Based on this experience, the CHDU techno-economic model includes hourly wind and solar generation profiles which are used to estimate how much electricity generated by on-site renewables can be used directly in the network heat pumps or exported. This article describes the sources of these profiles and how they are used within the model.
Wind and Solar Generation Profiles
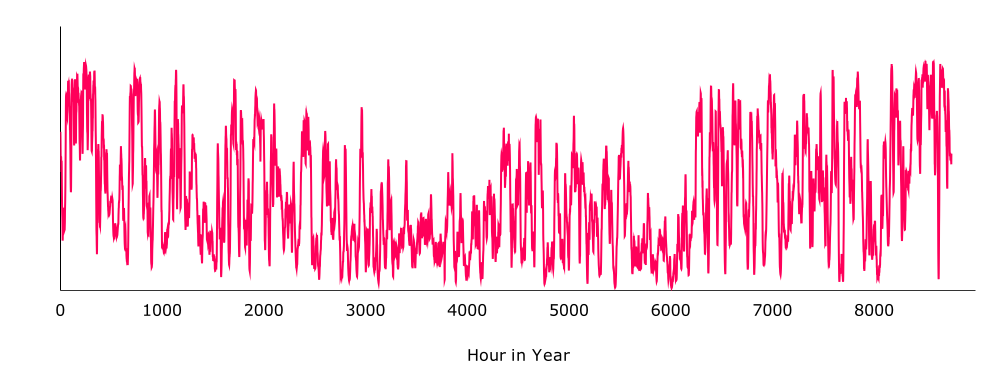
We’ve used the 2023 hourly wind generation profile from https://www.energydashboard.co.uk/historical which is an aggregated profile compiled from wind turbine sites across the UK. The Energy Dashboard site compiles wind generation data from multiple sources: Elexon wholesale market data and National Grid ESO for embedded wind generation, there is more information here: https://www.energydashboard.co.uk/data. The profile shape was extracted from the raw data by normalising it (dividing each hourly value by the total annual energy generated). Profiles from other years were tested in the model however they produced little variation in the overall model outputs. The normalised wind generation profile is presented below.
Solar Generation Profile
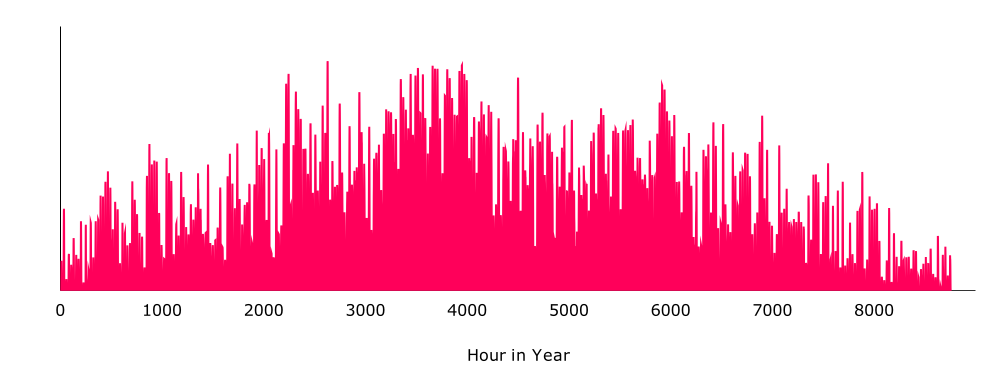
We’ve used the aggregated 2023 hourly solar generation profile from Energy Dashboard at https://www.energydashboard.co.uk/historical normalised by the total annual energy generation. The Energy Dashboard site compiles solar data from multiple sources: Elexon wholesale market data and PV Live for embedded solar generation. As with the wind profile, using a profile from a different year makes little difference to the final model outputs. The normalised solar generation profile is presented below.
How Wind and Solar Generation Profiles are Used
The CHDU techno-economic model uses the solar and wind profiles to estimate the amount of energy that is expected to be generated in each hour of the year, and hence how much will either be used by the heat network or sold to the grid. The normalised profiles are scaled so they sum to the target annual generation values, which are inputs to the model, and the combined hourly wind and solar generation profile is compared to the hourly electrical demand of the network heat pumps. Renewable electricity is used to power the heat pumps with any excess being sold to the grid, and any deficit being purchased from the grid.
Note that the CHDU techno-economic model only considers electricity sales to the grid and does not model electricity sales to a private offtaker via private wire. Selling electricity to a private offtaker would likely improve the financial performance of a heat network with on-site renewable generation since electricity may be sold at a higher price compared to the wholesale electricity market.
The figures below present snapshots of the amount of electrical energy generated and the amount of heat consumed as a proportion of the total annual energy for a week in winter and a week in summer. Note that the y-axis scales of the two figures are identical.
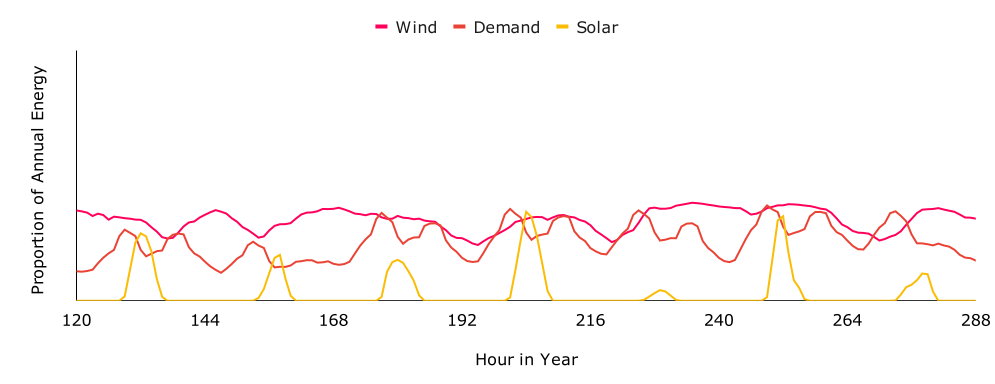
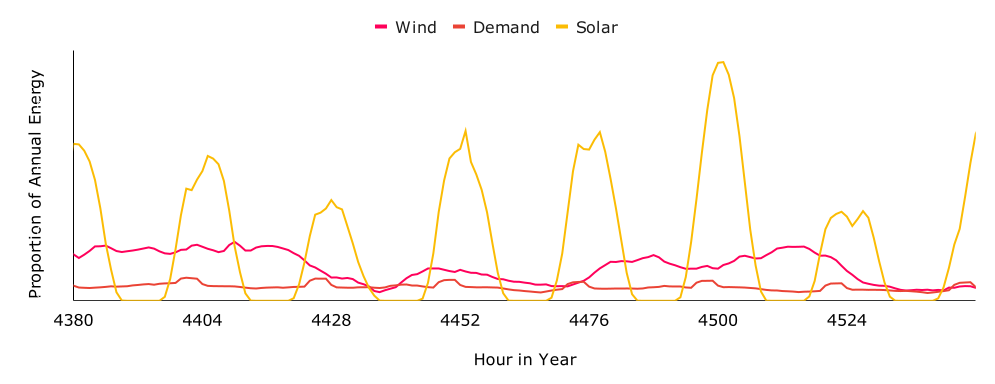
The figures indicate that wind generation and heat demand are a fairly good match in winter with solar generation being less beneficial due to the limited daylight hours. Wind generation and heat demand reduce in summer which is when most of the solar generation occurs.
The wind and solar generation profiles are also used to estimate the cost implications of including thermal storage, in the form of large hot water tanks. This is discussed in a separate article.
Limitations of Approach
The aggregated wind and solar generation profiles may be less ‘peaky’ than the generation profile at a specific site due to hourly peaks and troughs being aggregated at many sites across the country. This has two consequences:
- Storage may be modelled as being less beneficial to the network compared to reality since it is less likely that electricity generated during a windy or sunny day will exceed the electricity demand of the network.
- Conversely the aggregated profile is more likely to estimate some renewables generation during any given hour in the year due to it being windy or sunny somewhere in the UK. This results in some overprediction of self-consumption.
These limitations are considered to be acceptable since the aim of the CHDU techno-economic model is to inform a nationwide search for sites where a heat network could be a viable option to decarbonise heating. Including site specific generation profiles within the model is not feasible within the scope of the CHDU project due to the considerable additional analysis that would be required, but could be used in more detailed, site specific analyses.
References
Energy Dashboard https://www.energydashboard.co.uk/historical
Banner Image Attribution:
Image sourced from www.flickr.com and licensed under the Creative Commons Attribution-NonCommercial-NoDerivs 2.0 Generic license.