Introduction
Heat networks supply heat to connected buildings to provide space heating and/or hot water. The heat required by the buildings is known as their thermal demand. There are three key aspects of thermal demand which must be understood when designing a heat network:
- Peak thermal demand – the maximum thermal demand that the network must meet. This is used to calculate the peak power requirements of the heat source and to size back-up heat supplies and thermal storage.
- Annual thermal demand – the total accrued thermal demand across a year of operation.
- Thermal demand profile – how the thermal demand of connected buildings varies throughout the year. This is influenced by climatic conditions and consumer behaviours. Understanding how the thermal demand varies throughout the year is important when considering variable costs of heat generation e.g. variable rate electricity tariffs.
The CHDU techno-economic model has been developed to accept annual thermal demand values for domestic and non-domestic buildings as inputs, since these are specific to each heat network site. Generalised thermal demand profile shapes for domestic and non-domestic buildings have been derived following the methods described in this article, along with the peak thermal demand.
Source of Thermal Demand Profiles
PyLESA (Python for Local Energy Systems Analysis, https://github.com/andrewlyden/PyLESA) is an open source modelling tool for the planning-level design of local energy systems, and provides hourly heating demand profiles for a large selection of domestic building types and ambient air temperatures. PyLESA also allows users to generate demand profiles of domestic buildings aggregated across a network.
nPro (https://www.npro.energy/) is a commercial heat network design software which contains hourly demand profiles for a range of non-domestic building archetypes. The demand profiles presented in nPro are derived from a variety of research work as described here: https://www.npro.energy/main/en/help/faq#hide31a.
We were also provided access to half-hourly gas consumption data for a variety of public buildings which were heated using gas boilers, including a town hall, leisure centres, a primary school, a hotel and council offices of various sizes.
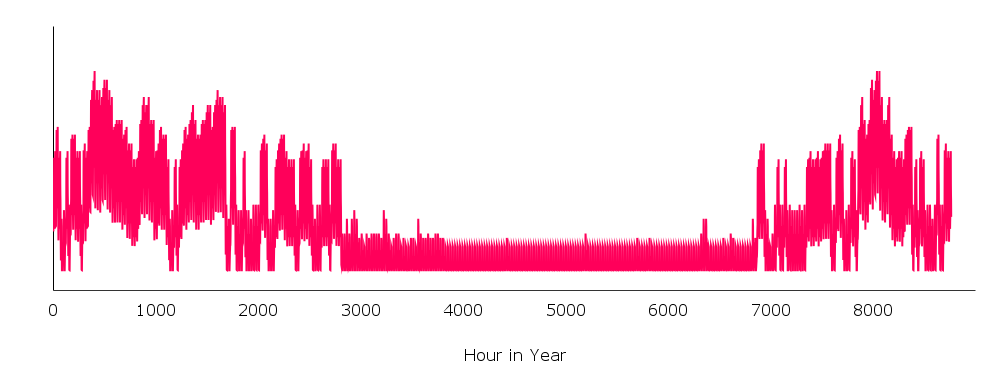
Non-domestic demand profile shape
We have used an aggregation of 17 hourly non-domestic thermal demand profiles from nPro in the CHDN techno-economic model including retail buildings, schools, leisure centre with swimming pool, a nursing home and theatre. The aggregated profile was generated by summing the individual profiles by hour across all 17 building types, and applying a 4 hour rolling average to smooth out hourly variation, which is consistent with the approach adopted by PyLESA.
Including the aggregated nPro demand profile in the techno-economic model resulted in the financial performance of a network being worse than following a similar process using the actual gas data values (assuming a boiler efficiency of 90%). Hence the nPro demand data is used in the CHDN techno-economic model.
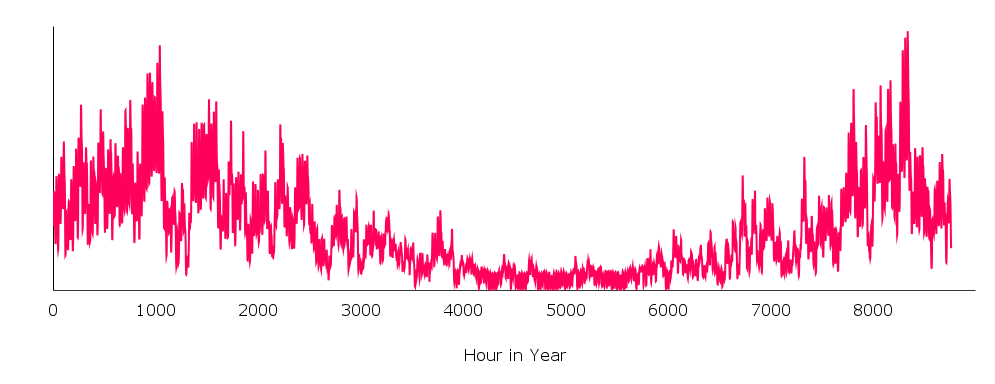
Domestic demand profile shape
Baseline hourly demand profiles were generated using PyLESA using 2023 hourly air temperature profiles obtained from BizEE Degree Days. A 200 building network was simulated modelling 20 properties of 10 house types to create an aggregated domestic thermal demand profile. Property types included detached, semi-detached and terraced housing, bungalows and flats of different ages. PyLESA applies a 4 hourly rolling average after summing the demand profiles across the 200 buildings to account for diversification i.e. not all buildings will simultaneously require their peak demand, which equates to a diversification factor of approximately 63%.
Sensitivities were run assessing how the aggregated demand profile shape changed due to different ambient temperature profiles (e.g. Inverness vs Southampton) however, the CHDN techno-economic model was not particularly sensitive to the changes in profile shape (i.e the changes in total demand at these different locations is more important).
Combined demand profile
The total heat network thermal demand profile used in the CHDN techno-economic model is generated using the following steps:
- Normalise the hourly, annual PyLESA domestic and nPro non-domestic profiles to get the profile shapes.
- Scale the normalised profiles by the site specific domestic and non-domestic annual thermal demands which are inputs to the CHDN techno-economic model such that the sum of the hourly demand profiles equal the input demand values.
- Sum the scaled profiles.
- Add the heat loss to the combined profile as a fixed hourly value (to represent the heat network being operational all year).
The combined hourly profile is used to calculate the hourly heat pump electricity demand and backup fuel demand. The maximum value of the combined profile is treated as the peak demand that must be met by peaking/back-up plant.
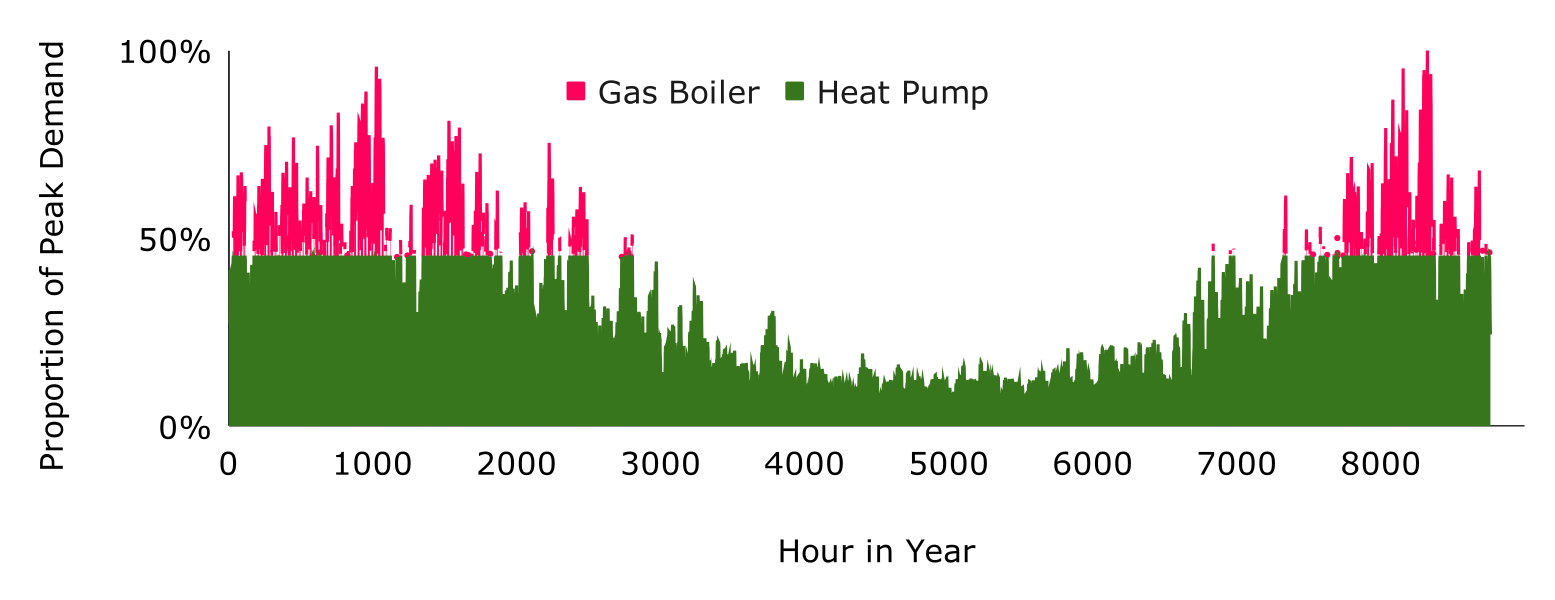
Heat pump and back-up plant sizing
The maximum value in the combined and scaled thermal demand profile is the peak thermal output which the network heating plant must provide. The aim of the CHDU project is to support the development of low-carbon heat networks however sizing the heat pump based on this maximum demand value would result in a heat pump being significantly oversized for much of its operation. Instead the CHDN techno-economic model aims to provide 90% of the total annual demand using heat pumps, with 10% of the demand provided by back-up hydrocarbon boilers. Calculations indicate that this reduces the required peak output of the heat pump by about 50%, significantly improving the financial viability of the heat network, while still achieving a carbon reduction of ~85% compared to 100% hydrocarbon boilers. The back-up plant is still sized to meet 100% of the peak thermal demand to ensure that the network can still provide 100% of the thermal demand to consumers during heat pump outages. The hydrocarbon boilers could be replaced in future with electric boilers to further reduce carbon emissions.
References
PyLESA: https://www.softxjournal.com/article/S2352-7110(21)00044-3/fulltext
PyLESA source code: https://github.com/andrewlyden/PyLESA
nPro – District Energy Planning Tool. Available online: https://www.npro.energy (Accessed on 01.08.2024).
BizEE Degree Days, https://www.degreedays.net/